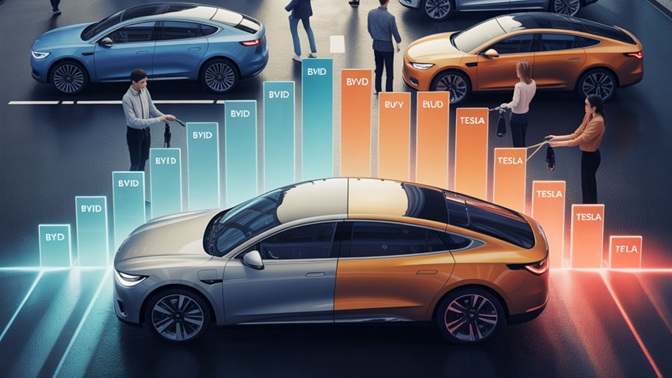
Tesla grip on Europe is loosening, and the numbers are hard to ignore. In July 2025 the automaker’s registrations across the EU, the UK and EFTA fell a whopping 40% year‑over‑year — down to 8,837 units from 14,769 a year earlier. That drop came even as electrified vehicles (battery EVs, hybrids and plug‑ins) captured a record 59% of new registrations across the region. Europe’s appetite for electrified cars is booming, but European buyers are increasingly looking beyond Tesla.

Quick snapshot — July 2025
- Tesla registrations (EU + UK + EFTA): 8,837 (down ~40% YoY)
- Tesla in EU only: 6,600 units (down 42.4% YoY)
- BYD registrations in the region: 13,503 units (up 225% YoY)
- Electrified market share (BEV + PHEV + hybrid): 59% — all‑time high
What the data shows
| Metric | July 2025 |
|---|---|
| Tesla (EU+UK+EFTA) | 8,837 units (-40% YoY) |
| BYD (EU+UK+EFTA) | 13,503 units (+225% YoY) |
| Electrified share | 59% of new registrations |
| Tesla market share (month) | 0.8% (down from 1.4%) |
| Tesla YTD share | 1.5% (down from 2.3% in 2024) |
| BYD YTD share | 1.1% (up from 0.3% in 2024) |
Several forces are colliding to reshape Europe’s EV leaderboard.
- Price and product mix. Chinese makers like BYD are flooding the market with competitively priced EVs and hybrids, often loaded with features buyers want. That value proposition matters in Europe, where consumers compare whole‑life costs, features and incentives closely. BYD’s sharp pricing and broad lineup make it an attractive alternative to Tesla’s pricier offerings.
- More than pure BEVs: Europe’s hybrid moment. The region isn’t only buying full battery EVs. In July BEVs rose 39% year‑over‑year, PHEVs jumped 57%, and hybrids were up 14%. The mix suggests many buyers prefer a range of electrified options — including plug‑ins and hybrids — that fit different charging behaviors and budgets. BYD’s diverse portfolio, with many hybrid and plug‑in choices, aligns with this market.
- Brand perception and timing. The report notes that Elon Musk’s polarizing persona may be denting enthusiasm in Europe — a region where brand image and corporate behavior can affect buyer decisions. At the same time, Tesla’s refreshed Model Y has only produced tepid interest, and the new Performance trim is a high‑price halo that won’t move the affordability needle.
- Supply and market reaction. BYD’s surge (13,503 units in July) wasn’t just about sure‑fire demand — it also reflects rapid distribution, dealer support and aggressive launches. Tesla still leads in YTD share (1.5% vs BYD’s 1.1%), but the gap is shrinking fast — Tesla was at 2.3% in 2024 while BYD climbed from only 0.3%.
A quick comparison table
| July 2025 | Tesla | BYD |
|---|---|---|
| Registrations (EU+UK+EFTA) | 8,837 (-40% YoY) | 13,503 (+225% YoY) |
| Market share (month) | 0.8% | 1.2% |
| YTD share | 1.5% | 1.1% |
It’s not game over for Tesla in Europe. But the company faces a tough set of choices:
- Price adjustments: Expect pressure to compete on price. Tesla has discounted models in the past to stimulate demand; further adjustments could be on the table.
- Product tailoring: Introduce cheaper spec levels or region‑specific models that match European buyers’ needs — smaller‑range city BEVs, or more affordable trims without expensive options.
- Service and charging: Strengthen dealer service, local warranties and Supercharger access — areas where rivals can’t yet match Tesla’s network strength.
For European drivers like Anna in Berlin or Marco in Milan, this shift is welcome. More manufacturers competing means better deals, more choices and faster innovation. For fleet buyers and small businesses, BYD’s value proposition and hybrid options make electrification easier and cheaper.
But for Tesla owners and fans, this is a reminder that leadership in EVs isn’t permanent. It’s earned constantly — through pricing, product fit, brand trust and service.
The headline here isn’t just that Tesla fell; it’s how fast Europe is moving toward electrified transport. Year‑to‑date figures are striking: BEVs up 26% (1,376,720 units), PHEVs up 25% (703,615 units) and hybrids up 15% (2,755,421 units). Meanwhile, gasoline and diesel are in retreat: gasoline sales are down 21% year‑to‑date and diesel down 26%.
Those trends mean two things: opportunity and competition. Opportunity for automakers that can offer affordable, well‑equipped electrified vehicles aligned with European tastes. And competition — intense, fast and often subsidy‑driven — that will challenge incumbents who move slowly.
Tesla’s dip in Europe is real and meaningful, but it’s part of a larger story: Europe’s EV market is maturing and diversifying at breakneck speed. BYD and other Chinese brands are aggressive and well‑positioned to take share by offering affordable, feature‑rich EVs and hybrids. Tesla can fight back — with pricing, local models, or better service — but it will need to be nimble.
If you’re shopping for an EV in Europe right now: this is a buyer’s market full of options. Compare total cost of ownership, charging access and local service — and don’t assume brand pedigree will guarantee the best deal. The market is moving fast, and the winners will be those who match European buyers on price, features and trust.
Related Post
